Interpretable Factorization of ECG AI Classifiers
GitHub Repo: ECG Classifier Interpretable Factors
Using the logical-circuit decomposition introduced in the previous project, Deep Logical Circuits Project, I applied the method to interpret the AI classifiers for ECG signals. The ECG AI classifiers were trained to classify ECG signals as normal or abnormal. The logical circuit decomposition of the ECG AI classifiers revealed interpretable factors that were responsible for the classification of the ECG signals. The interpretable factors were combinations of combinations of intermediate classifiers that were either true or false. The logical circuit decomposition of the ECG AI classifiers provided insights into the classification of the ECG signals and helped establish trust in the AI classifiers.


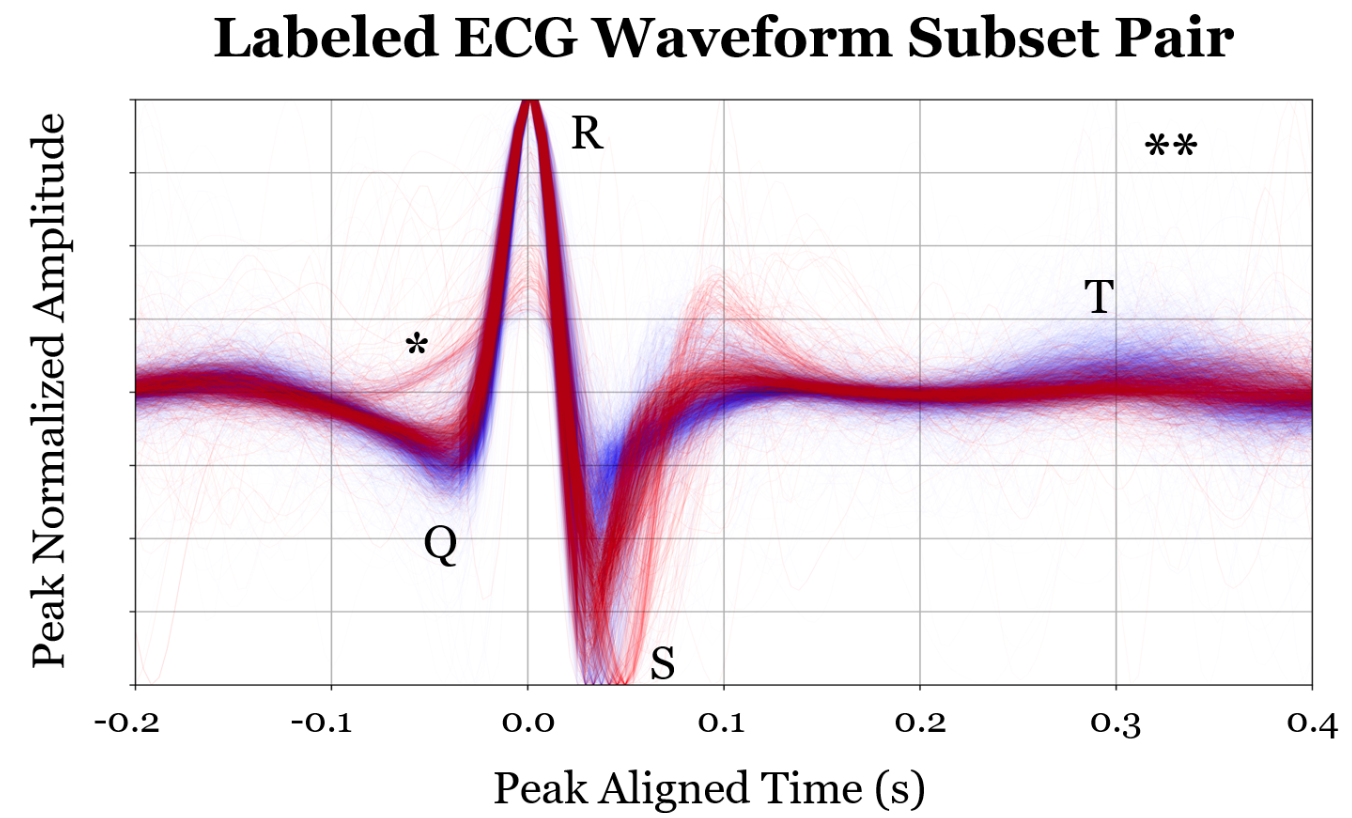
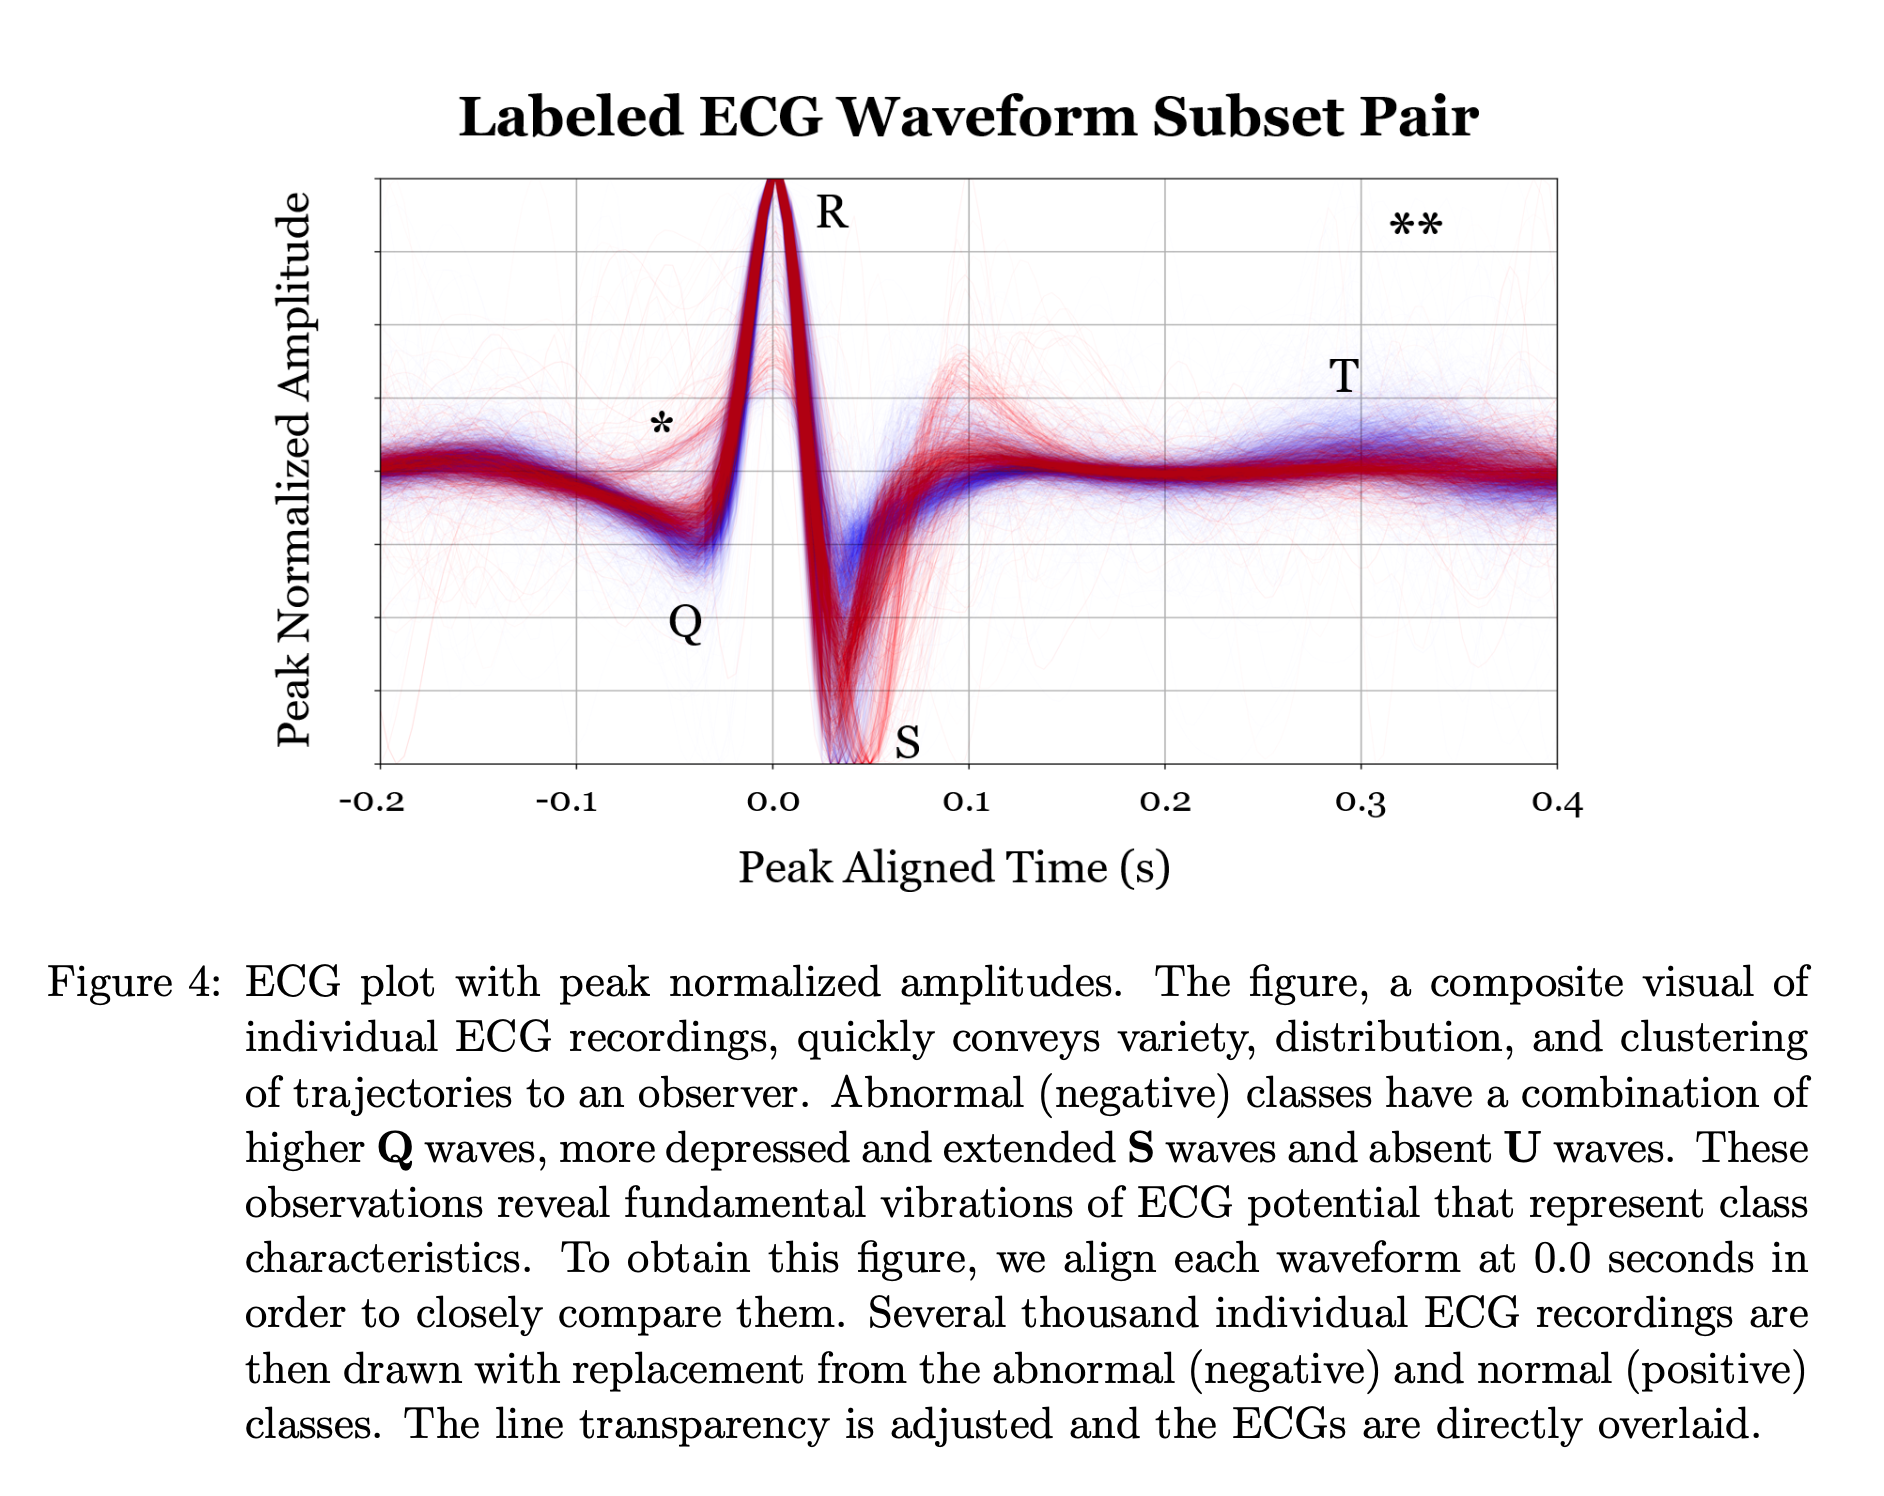
Lines are blended using alpha<1.0 and thin lines -- opacity implies substantial overlap.

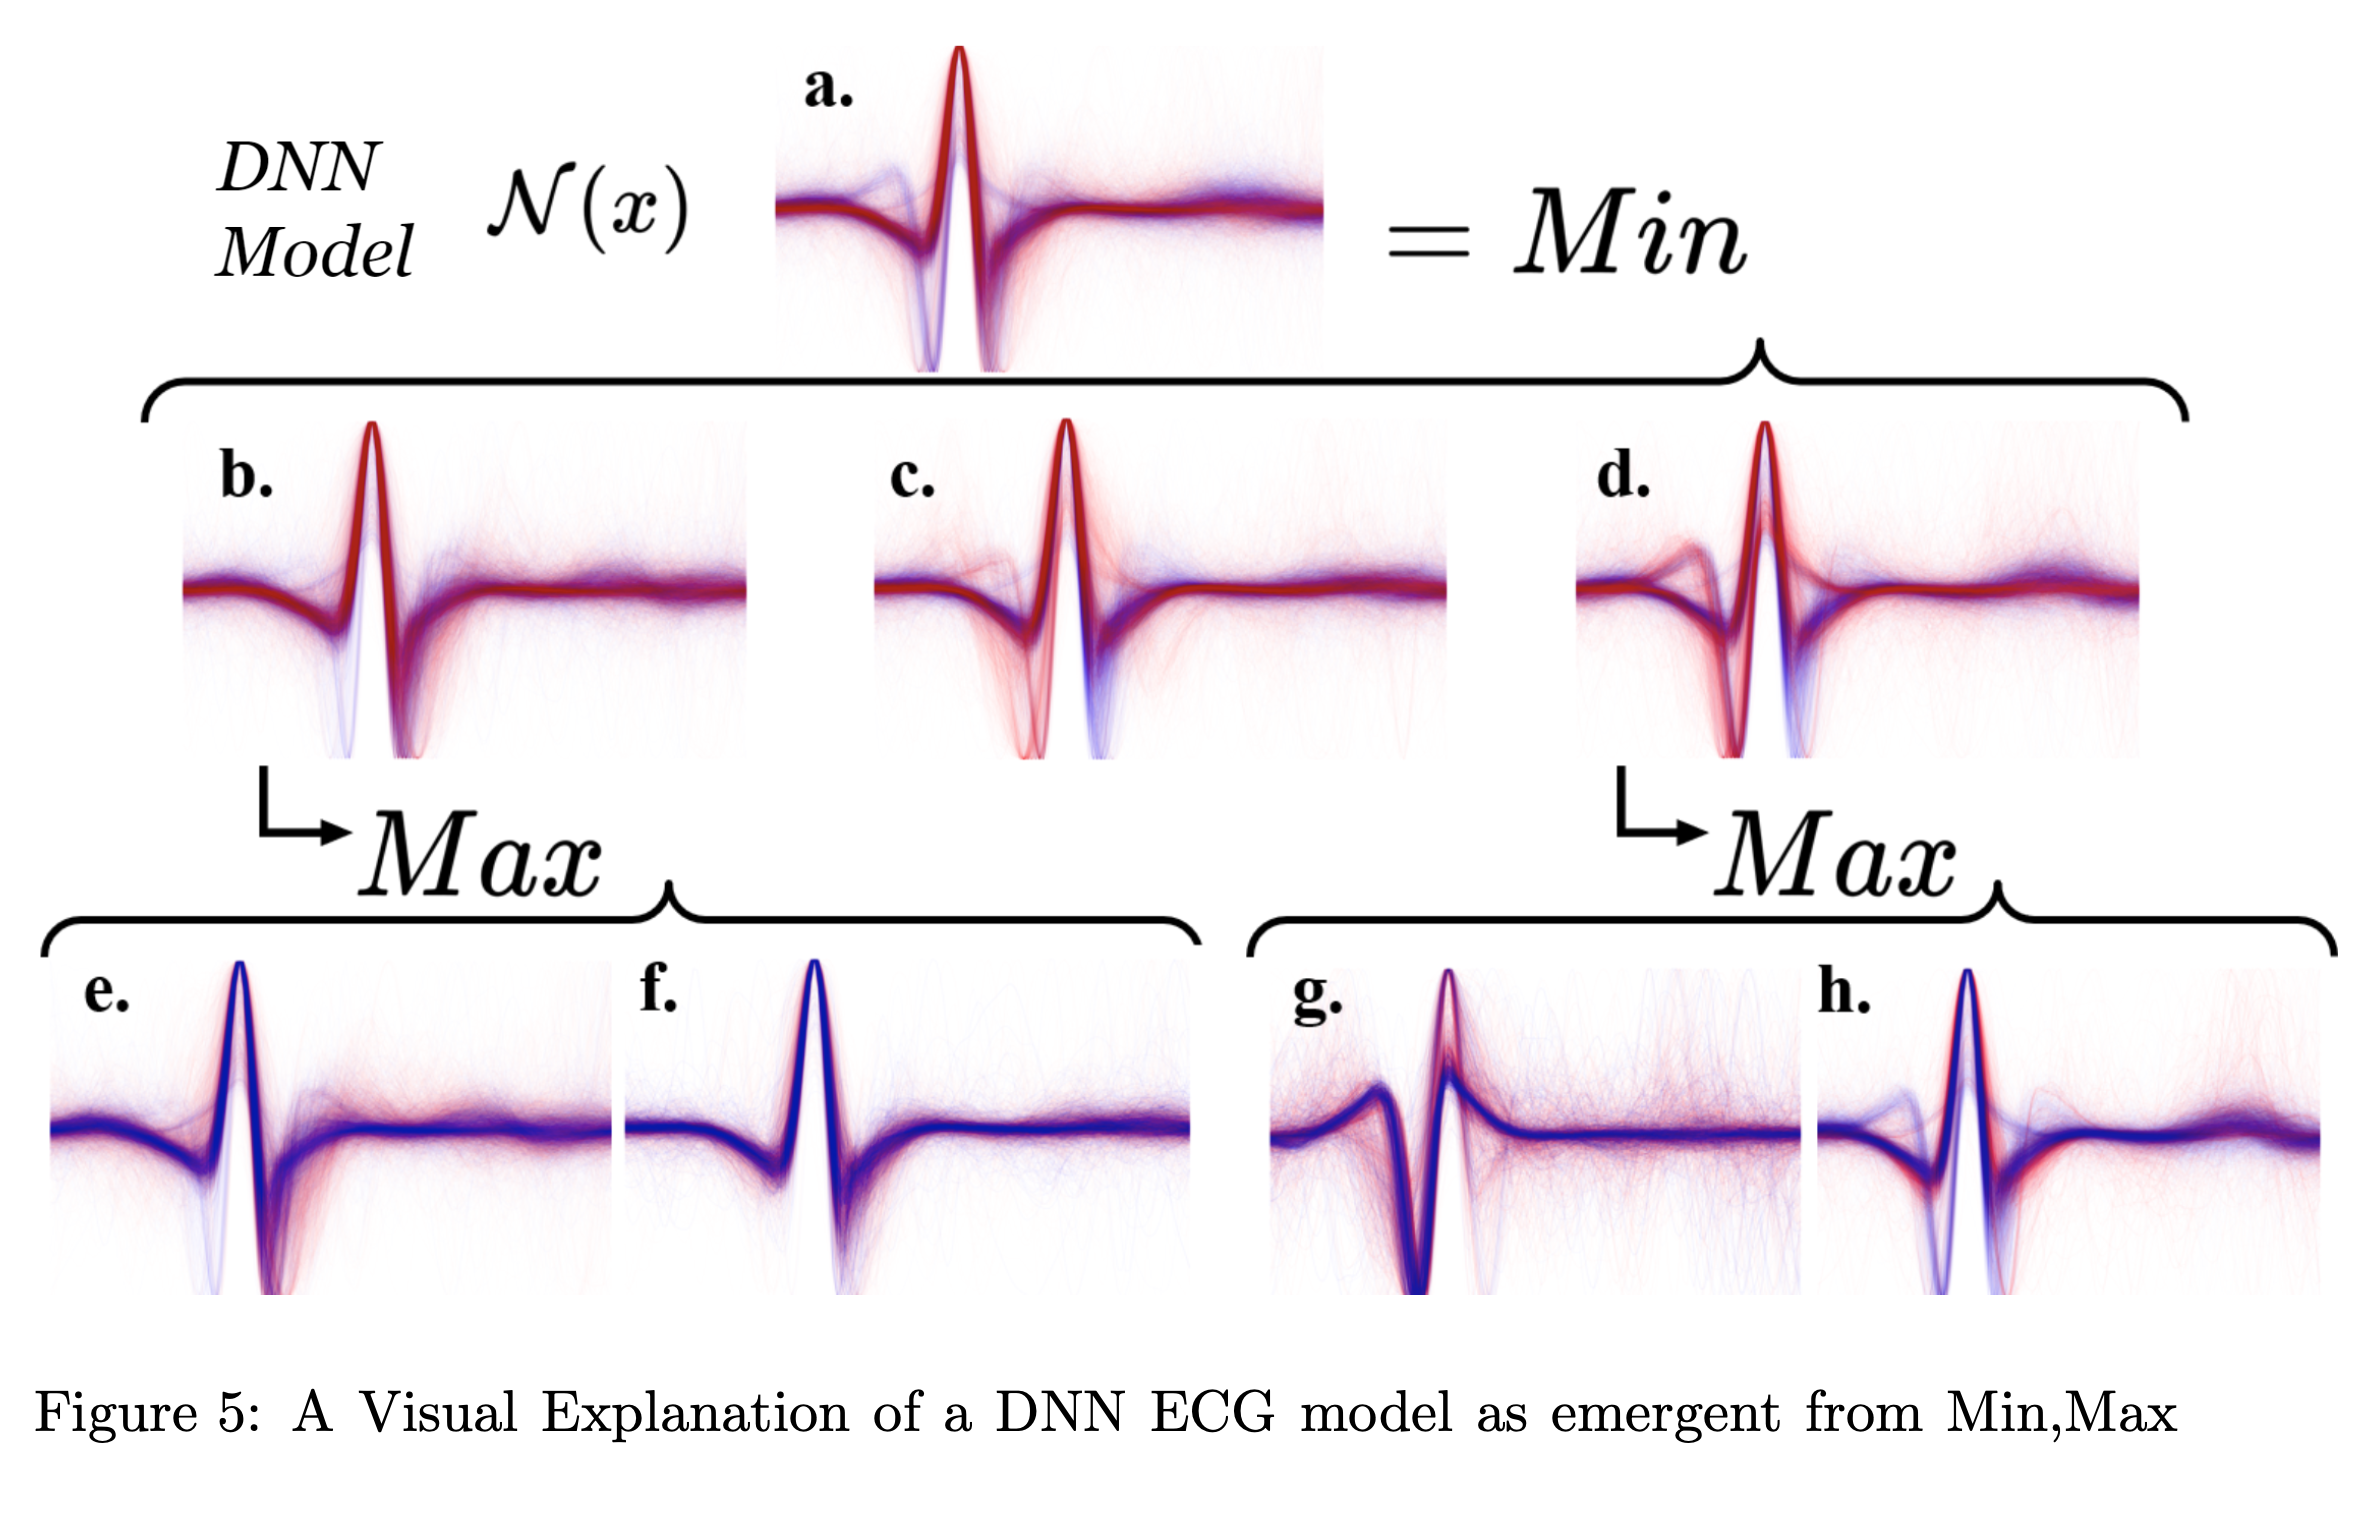
In this project therefore, our ecg overlay illustrations are our means of formulating “intuition” and “narrative” for each component black box and the role that it plays. In the following decomposition, I chose to only overlay the samples for which that component’s evaluation was critical for the final decision. In this way the interpretation is not of each component classifier in isolation, but of the classification decisions it makes which are important relative to the overall model behavior. The previous project showed the following decomposition but for MNIST dataset 0-4 vs 5-9 classifiers
However, unlike the previous project, there are no obvious subclasses a priori of ECG signals which naturally compose “abnormal” ecg signals as naturally as “0,1,2,3, and 4” compose the category “less than 5”. The question remaining to ask is whether we can still recover meaningful subcategories of data based on the component model classification behavior. Unlike the counting numbers, we won’t immediately have names for each of these subcategories. 1


Notice how component b. seems to classify as abnormal exagerated ST-Depression. Apparently some of the ECGs were inverted due to volage polarity being switched. Even though this had an unanticipated effect on the peak-alignment, the results and conclusions are still valid. In fact, notice how each component tends to be “responsible” for classifying either the upright or the inverted signals correctly.
Conference Paper
Machine Learning for Healthcare, 2020
With enough data, one would hope to be able to identify specific characteristic wave patterns associated with, say, Wolf-Parkinson-White syndrome. But, in reality, this condition is so rare that one would need far more data, and unless the model has to go out of its way to fit these data, it's unlikely to structurally reflect the abnormal subdivisions we use in our taxonomy.